Start Guide
Start Guide
Work spaces & Projects
Work spaces & Projects
Integrations
Integrations
User Roles
User Roles
Report Page
Report Page
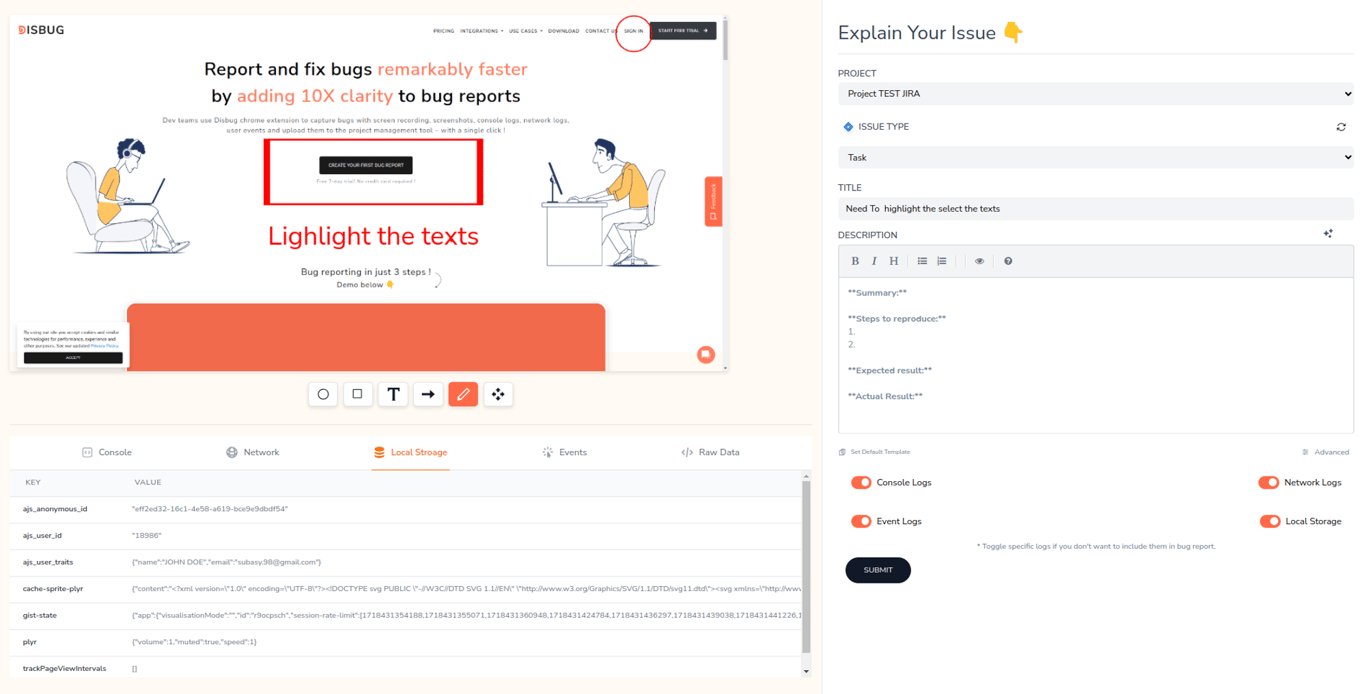
- Resync: "Click the Resync Button to synchronize your projects, especially if you've created integration projects. This allows you to add additional properties to your project."
- AI Generative Descriptions: "Click the Generate Description Button to create descriptions based on the title you provide. You can optionally include technical logs for more detailed descriptions."
- Choose Logs: "Use these Log Selection Buttons to choose which logs to include in your reports."
Set Default Template
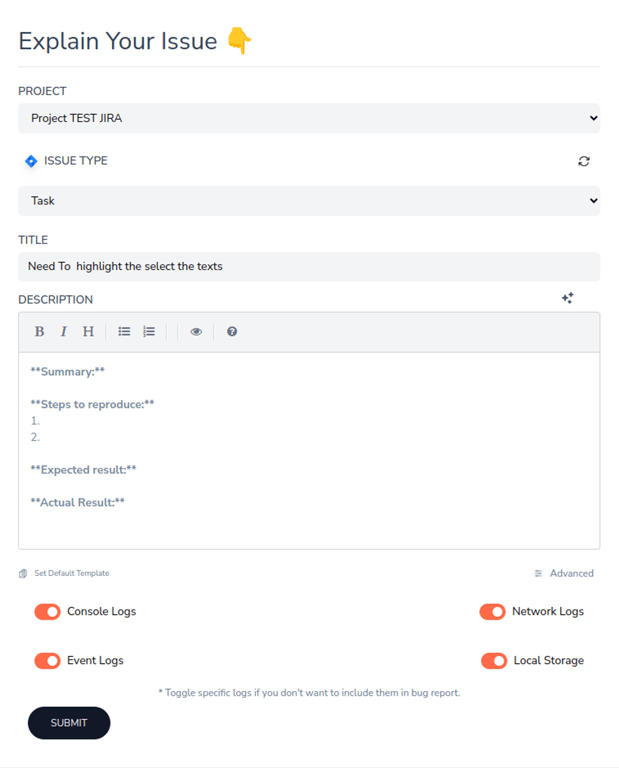
- Create commonly used text snippets for descriptions and store them within Disbug or another accessible location (e.g., project management tool).
- Users can copy and paste these snippets as a base for their descriptions, saving time and ensuring consistency.
Technical Logs
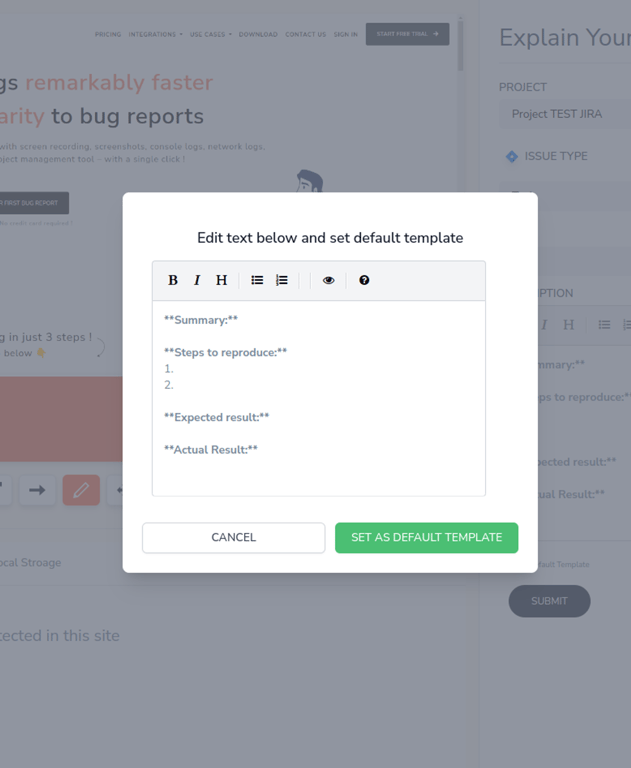
When you enable "Collect Technical Logs" in Disbug.io, it grants permission to gather detailed information about your browser's activity related to the issue you're reporting. This information can be invaluable for developers in diagnosing and resolving the problem. Here's a breakdown of the specific technical logs Disbug.io might collect:
1. Console Logs:
- These logs contain messages from web pages and browser extensions. They can reveal errors, warnings, or informational messages that might be helpful in understanding the issue.
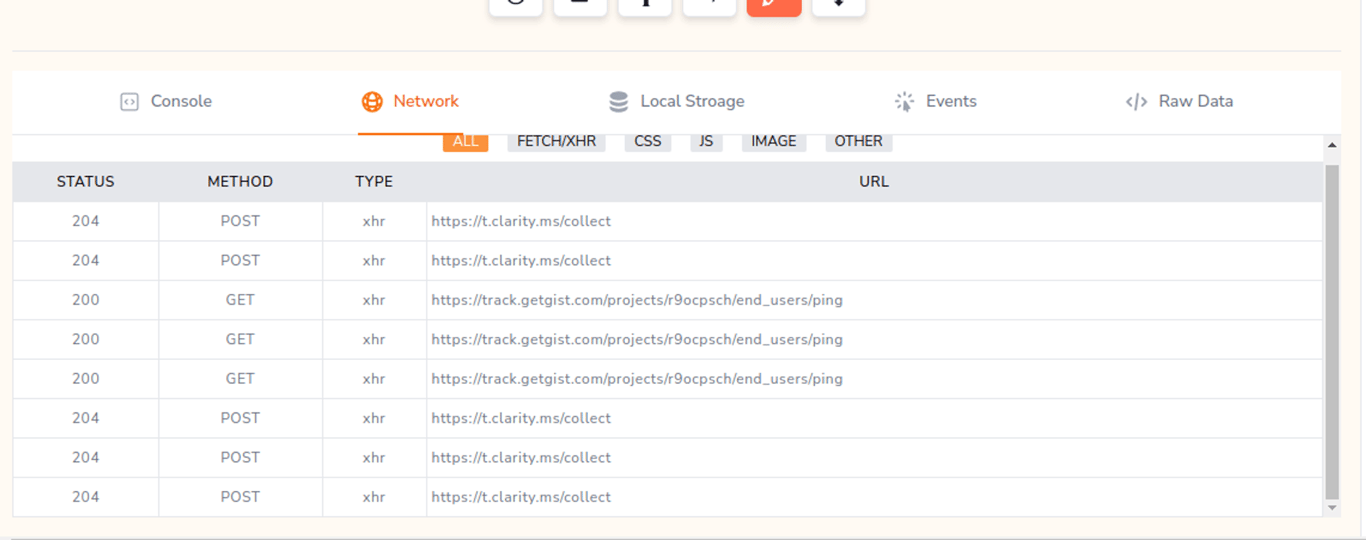
2. Network Logs:
- This data captures the communication between your browser and web servers. It includes details about requests made, responses received, and any errors encountered during data transfer. Network logs can help identify issues with loading resources, API calls, or network connectivity.
3. Event Logs:
- These logs record user interactions with the webpage, such as clicks, form submissions, or page navigation. Event logs can provide context for the issue by showing the actions that led up to the problem.
4. Local Storage Data:
- Websites can store small amounts of data on your browser for later retrieval. This local storage data can sometimes be relevant to the issue you're reporting, especially if it's related to user preferences or application state.
5. Raw Dta:
- This includes additional information about your browsing environment, such as browser version, operating system, and user agent. This data can help developers understand the context in which the issue is occurring and ensure any fixes are compatible with different systems.
Benefits of Technical Logs:
- Detailed Diagnosis: Technical logs provide developers with a wealth of information about the issue, making troubleshooting more efficient and accurate.
- Reproducibility: Logs can help developers reproduce the issue on their machines, allowing for faster resolution.
- Root Cause Analysis: By analyzing technical logs, developers can identify the underlying cause of the problem and implement a permanent fix.
Important Notes:
- Disbug.io should have clear privacy policies outlining how this data is collected, stored, and used.
- Users should have the option to opt-out of collecting technical logs if they prefer.
Refine image
1. Use Annotations:
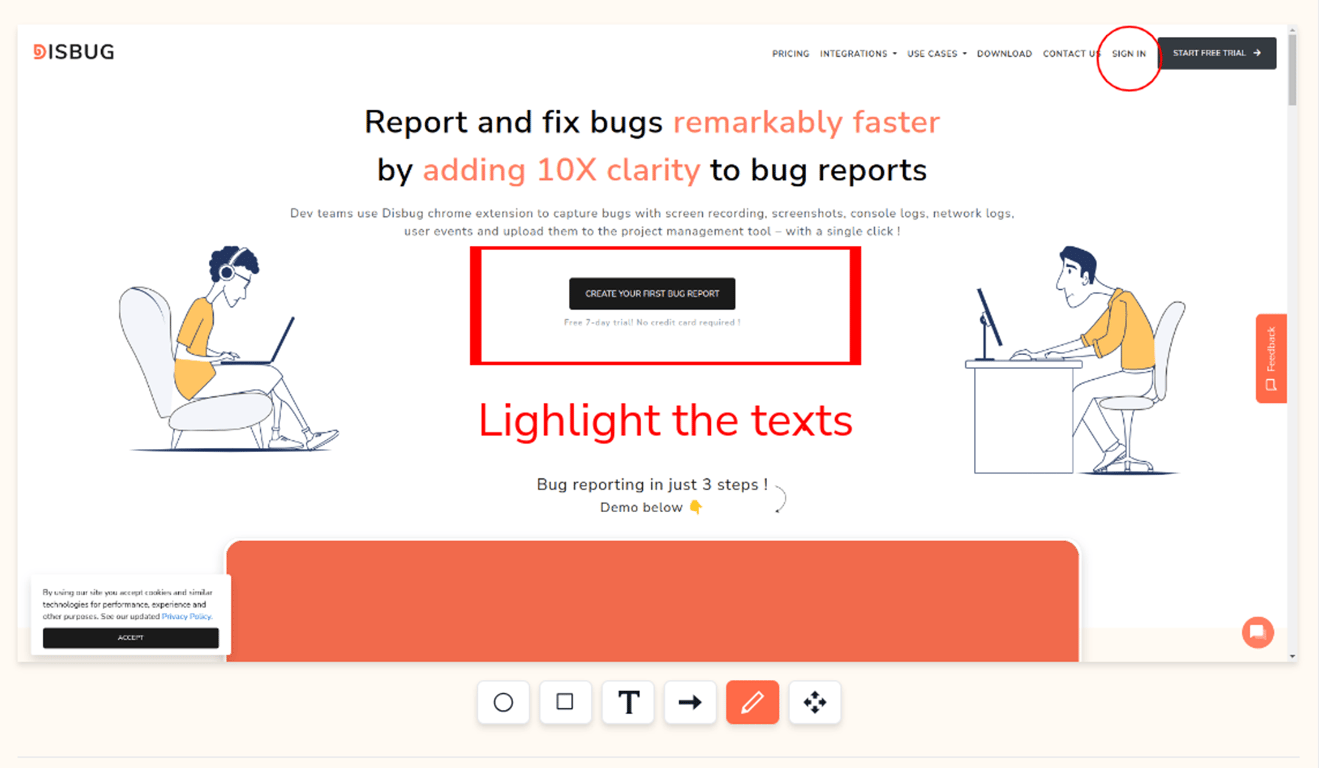
- While you can't directly edit the image within Disbug, you can utilize its annotation features to highlight specific areas of interest.
- Disbug likely offers tools like arrows, shapes, and text boxes to pinpoint the problematic sections in your image report.
2 Capture Specific Areas:
- If you only need to focus on a particular section of a webpage, consider using Disbug's capture tools to grab a specific area instead of the entire page. This can create a cleaner and more focused image for your report.
3. Combine Text Descriptions:
- In some cases, a detailed text description alongside the image can be more effective than editing the image itself. Clearly explain the issue and reference specific areas in the image for better understanding.
